

Solar System Optimization
SYSTEM OPTIMIZATION & REPOWER
Your solar system is supposed to be appreciating. After 10 years, most aren’t.
Most aging commercial solar systems quietly lose 10 to 25 percent of their original generation. The savings stack reverses with it. We diagnose what is failing, replace what is failing, and restore the system — using your existing infrastructure where we can, with Section 179 and accelerated depreciation modeled into the deal.
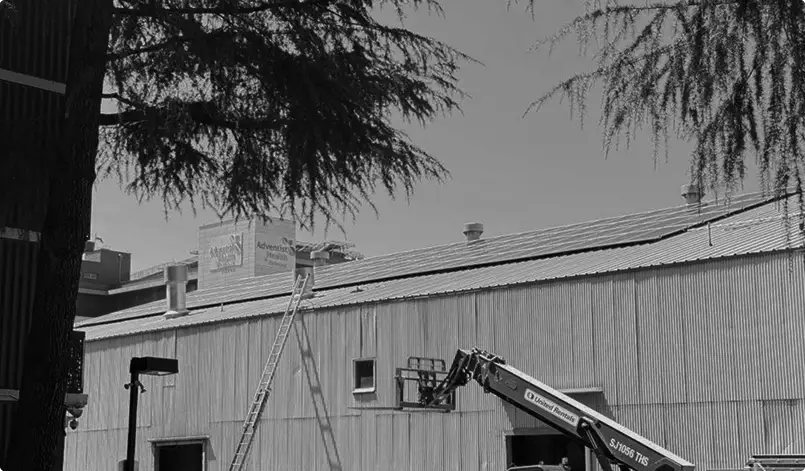
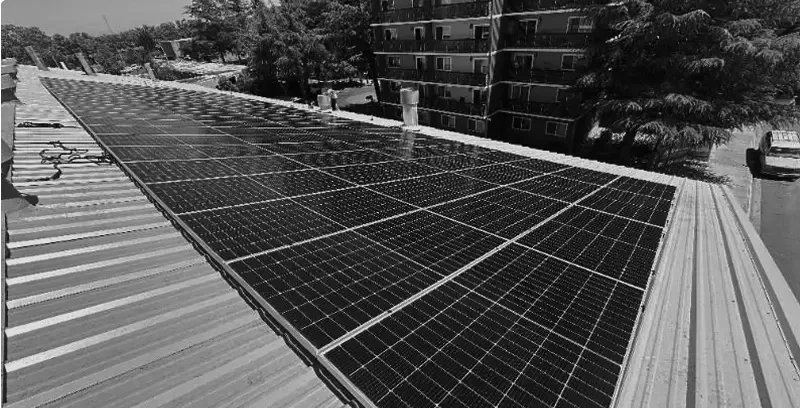
Solar systems don’t fail loudly. They fail one panel at a time.
Your utility bill rises every year. Some of that is rate inflation — the utilities raise prices, and your bill follows. Most owners assume the rest is normal. It often isn’t.
Commercial solar arrays installed before 2015 were built with panels that degrade faster than current generations, with inverters whose electrolytic capacitors begin failing around year 10 to 12, and with monitoring systems that are too coarse to flag panel-level failures. The system reports as ‘operating.’ Half of the panels can be effectively offline before anyone notices.
We pull the granular production data, run a site inspection with thermal imaging and IV-curve testing, and quantify what the array is actually generating against what it should be generating. If the gap is significant, the financial case for restoration is usually stronger than the financial case for the original install — because most of the infrastructure is already there.
The three most common causes of solar underperformance
Aging components, environmental conditions, and equipment failures quietly reduce energy production, lowering savings and long-term system performance.
- 01
Panels
Microcracks, hotspots, failed bypass diodes, junction box failure.
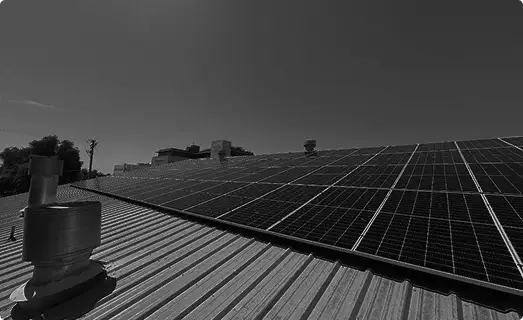
Individual panels in older arrays fail through several mechanisms — physical microcracking from thermal cycling, hotspot formation from cell mismatch, bypass-diode failure that takes whole strings offline, junction-box water intrusion, and PID (potential induced degradation). One failed panel in a string can drag the entire string’s output down. The monitoring portal does not always show it.
- 02
Inverters
Electrolytic capacitors. Fans. Firmware.
Individual panels in older arrays fail through several mechanisms — physical microcracking from thermal cycling, hotspot formation from cell mismatch, bypass-diode failure that takes whole strings offline, junction-box water intrusion, and PID (potential induced degradation). One failed panel in a string can drag the entire string’s output down. The monitoring portal does not always show it.
- 03
Soiling & Shading
Dirt, vegetation growth, and post-install obstructions.
Individual panels in older arrays fail through several mechanisms — physical microcracking from thermal cycling, hotspot formation from cell mismatch, bypass-diode failure that takes whole strings offline, junction-box water intrusion, and PID (potential induced degradation). One failed panel in a string can drag the entire string’s output down. The monitoring portal does not always show it.
What the data says about systems by age.
System Age
Typical performance vs. Nameplate
Most common issues
Most common ROI on restoration
92–97% of nameplate
Soiling, isolated panel failures
Low / not usually material — cleaning and minor repairs
82–92% of nameplate
Increasing panel failures, early inverter degradation, monitoring gaps
Medium — selective panel replacement and inverter service often pays back in 3–5 years
70–85% of nameplate
Significant panel failures, inverter end-of-life, outdated monitoring
High — partial repower frequently pays back in 2–3 years with tax structuring
55–75% of nameplate
Major panel population failures, multiple inverter failures, racking corrosion
Highest — full repower often justified; existing racking and BOS used where possible
A Structured diagnostic process built to restore performance
Production data review
We pull granular generation data from your monitoring portal and compare it to what your array should be producing given size, orientation, and irradiance — 1–3 days
Site inspection with thermal imaging
On-site thermal imaging of every panel under load, electrical testing of every string, inverter inspection, racking and wiring assessment — 1 day on-site
Tax Advantages
A documented report quantifying current vs. expected output, identifying every component recommended for replacement, with modeled cost and ROI — 1–2 weeks
Optimization proposal
If the math justifies the project, a specification-grade proposal with the capital structure modeled in — 1 week
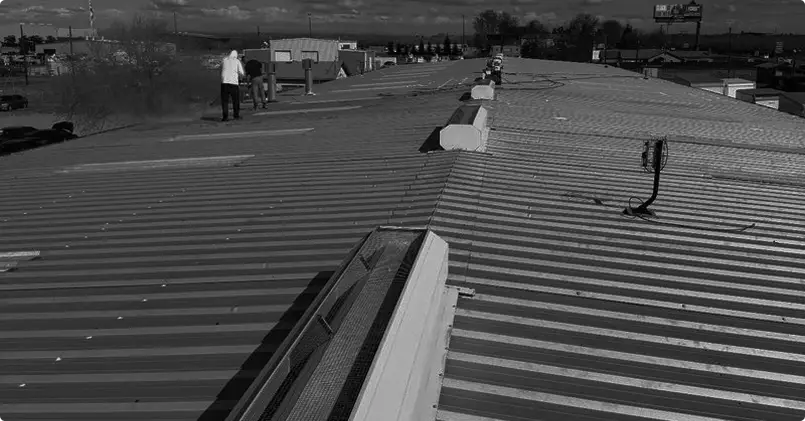
David’s system was operating at 65 %. He didn’t know.
David is a Bay Area commercial property owner. His solar array, installed in the early 2010s, had been reporting as ‘operational’ on the original monitoring portal for years. His utility bills had been climbing faster than his neighbors’. He called us to ask whether the system was still earning what it was supposed.
We pulled the granular production data and ran a thermal-imaging inspection. The system was generating at 65 percent of nameplate. Of the panels in the array, roughly half had degraded enough to be effectively offline — microcracks, failed bypass diodes, junction-box failures, and several full strings down due to wiring degradation. The inverters were near end-of-life.
We replaced 1,100 panels and the inverters using the original racking, wiring infrastructure, and balance-of-system components. The system returned to roughly nameplate generation. David reclaimed approximately $7,350 per month in utility savings — $88,200 per year — that he had been silently losing. The structuring combined Section 179 expensing, accelerated depreciation, and federal ITC eligibility on qualifying components, producing a tax shield that covered the substantial majority of the project cost. ROI was approximately two years.
The math on optimization is usually better than the math on a new install.
When we optimize an existing system, most of the infrastructure stays in place. Racking, conduit, wiring, interconnection, switchgear, structural roof penetrations — the expensive items — are already there. The replacement scope is panels, inverters, and monitoring hardware. The capital cost is a fraction of a new install for the same restored generation.
The tax structuring is favorable. Section 179 expensing applies to qualifying tangible property placed in service — the new panels, the new inverters, the new monitoring — against current-year taxable business income. Federal ITC is available on qualifying components. Accelerated depreciation modeling follows the same OBBBA-era framework we apply to new installs. The combined first-year tax shield often covers the majority of the project cost.
The outcome is a system restored to roughly nameplate output, a reclaimed monthly utility savings stack, and a tax position that funds most of the work. The asset goes from quietly bleeding NOI back to creating
Everything Required To Restore System Performance
Every optimization project is tailored to the system’s condition, combining diagnostics, repairs, replacements, and monitoring upgrades.
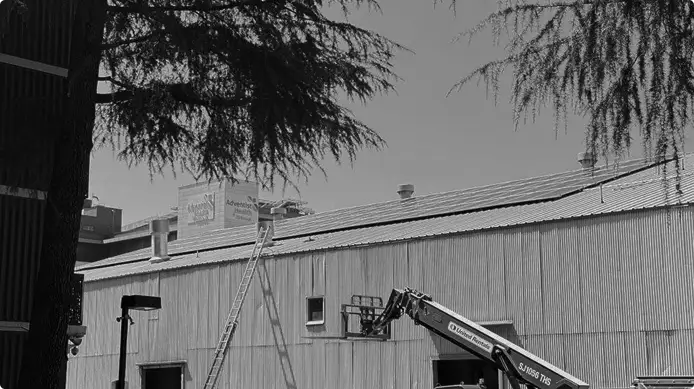
Cleaning
Commercial-grade panel cleaning.
Annual or semi-annual cleaning programs that recover 5–15% of generation lost to soiling. The lowest-cost intervention on this list.
Inspection
Thermal imaging and IV-curve testing.
Documented panel-by-panel inspection with thermal cameras and electrical testing. The diagnostic that drives every other decision on this page.
Panel replacement
Selective or full-array panel replacement.
Replace failed panels using existing racking and wiring. New current-generation panels matched to existing string voltage and inverter compatibility.
Inspection
Inverter replacement and monitoring upgrade.
Replace aging inverters with current-generation hardware. Upgrade to panel-level or string-level monitoring so future failures are flagged the moment they occur.
Answers Before You Start The Project
How do I know my solar system is underperforming?
Yes. Battery systems can support critical loads during utility outages, depending on system design and facility requirements.
What does an inspection cost, and what does it include?
We work with leading roofing manufacturers and offer warranty options that can cover both materials and workmanship, depending on the system selected for your project.
Can you replace just some of the panels, or do you have to redo the whole array?
Most commercial roofing projects are completed within two to six weeks, though timelines can vary based on building size, weather conditions, and project complexity.
Will the new panels work with my existing racking and inverters?
Yes, our team manages the entire permitting process and coordinates all required inspections to ensure your project remains compliant with local regulations.
How does the tax structuring work on a repower or optimization project?
Yes, our team manages the entire permitting process and coordinates all required inspections to ensure your project remains compliant with local regulations.
- Start here
Tell us about the project.
Fifteen minutes of intake gives us enough to decide whether the project is a fit. We come back with a clear answer either way.